Make money with covered calls

Tuesday 15 October 2013

Technical Indicators

          There are several technical indicators, but every one does not need to study all, as that can confuse a Forex trader. It is better to concentrate to selected few indicators only. Some of the key indicators used in technical analysis are mentioned as below.
  • Bollinger Bands
  • MACD
  • RSI
  • Stochastic
1. Bollinger Bands: - Bollinger Bands are invented by John Bollinger in 1980's. It has evolved from the concept of trading bands. Bollinger Bands consist of:                                                                         
  • A middle band being a N-period simple moving average.
  • An upper band at K times a N-period standard deviation above the middle band.
  • A lower band at K times a N-period standard deviation below the middle band.
          Typical values for N & K are 20 and 2 respectively.
          If the price rise above the upper band, after having remained between the two bands for quite sometime, then it indicates that price is now bound to go higher and buying can be initiated. If the price falls below the lower band, after having remained between the  two bands for quite some time, then it indicates that price is now bound to fall and hence selling can be initiated.
          Many traders use the moving average line or middle line to initiate their trades. When the price of security rises above the middle line they initiate their buying and when the prices of a security falls below the middle line they initiate selling. below chart illustrates Bollinger band signals.
 2. Moving Average Convergence Divergence (MACD): - MACD stands for Moving Average Convergence Divergence,  is one of the commonly used indicators in Forex trading analysis. It was invented by Gerald Apple. MACD shows the relationship between two price moving averages. A 9 day EMA of MACD called the 'signal line", is then plotted on MACD, to give the buy and sell signals.
3. Relative Strength Index (RSI): - Relative strength Index is a popular momentum oscillator, developed by J. Welles wilder. RSI measures the relative changes between the higher and lower closing prices and turns the information into a number that ranges from 0 to 100. The 70 and 30 values are used as warning signals, whereas values above 85 indicates an overbought condition and values under 15 indicates an oversold condition and are relatively known as buying and selling signals.
4. Stochastic: - Stochastic oscillator is invented by George Lane, is a momentum indicator used in technical analysis. Stochastic oscillator is plotted on a scale of 0 to 100. It is used to provide by and sell signals and suggests over bought or over sold signals. Two oscillator indicators i.e., (%K) a fast indicator and (%D) a slow indicator are used for analysis. Where value of %K or %D goes above 80 it is considered to be over bought and when it falls below 20 it is considered to be over sold. Buy and sell Signals is given when %K crosses through the %D line. A buy signal is given when %K crosses up through %D and a sell signals when it crosses down through%D.

Technical Analysis: - Candlestick Patterns

          Let us take a look at the basics of candlestick  and how they are read.
          The hollow (White) or the the filled (black) portion of the candlestick is called the body, which represents the opening and closing price. The long thin line above and below the body is known as shadows or tails, which represents the high & the low price.
          White  Candle represents the bullish because the stock price increases during the period and the black candle represents the bearish because the price decreases during the period.
          Some of the important candlestick pattern are discussed below:
  1. Doji: - Doji is formed when the opening and closing prices are virtually equal. The length of the upper and lower shadows can vary. 
    Doji represents indecision or tug-of-war between buyers and sellers. When Doji appears after an uptrend, it signals that the uptrend could be nearing to an end.  Even after doji forms, further downside is required for bearish confirmation. When a doji appears after a downtrend, it signals the downtrend could be nearing to an end. Even after the doji forms, further upside is required for bullish confirmation. Following are the types of Doji: 
  2. Bullish Engulfing Pattern: - Bullish Engulfing is a bullish reversal pattern. It could be formed at the end of a downtrend or within an uptrend. It is two-candle pattern. The first candle has small bearish body and the second candle has a large bullish body. The small body of the first candle represents hesitancy to continue a downtrend, while the large body of the second candle represents that the buying pressure has overwhelmed the selling pressure, suggesting a potential reversal of trend.  
     
  3. Bearish Engulfing Pattern: - Bearish Engulfing is a bearish reversal pattern.  It could be formed at the end of an uptrend or at the resistance. It is also a two-candle pattern. The first candle has a small bullish body and the second candle has a large bearish body. The small body of the first candle represents hesitancy to continue an uptrend, while the large body of the second candle represents sellers have overwhelmed the buyers, suggesting a potential reversal of trend. 
     
  4. Hammer: - Hammer is a bullish reversal pattern. It can be formed at the end of a downtrend or at the support. Its appearance is top-heavy with the real body being either color (whit or black). A hammer has a long lower shadow and this is the most important aspect of this candle. It indicates that the bears attempted to push price lower, but failed and the bulls are stepping in.  The following day needs to confirm the Hammer's bullish reversal signal with a strong bullish candle which is a gap up or a long white candle on a high volume. 
  5. Hanging Man: - Hanging man is a bearish reversal pattern. It is formed at the end of an uptrend or at the resistance. A hanging man is top-heavy with the real body and has a long lower shadow. The color of the real body is irrelevant. The long lower shadow formed indicates the selling pressures might just begin. The next trading day needs to confirm the Hanging Man's bearish signal with a strong bearish candle which is a gap down or a black candle on a high volume. 
  6. Shooting Star: - Shooting star is a bearish reversal pattern. It could be formed at the end of  an uptrend, or at the resistance. It is opposite pattern of Hammer. A shooting star is a bottom-heavy with a long upper shadow. The long upper shadow of a shooting star is the major important aspect of the pattern. It indicates that bulls attempted to push price higher but failed. The following day needs to confirm this with a strong bearish candle which is a gap down or a long black on a strong volume.
  7. Inverted Hammer: - Inverted Hammer is a bullish reversal pattern. It looks similar the shooting star pattern but it is formed at the end of a downtrend or at the support.  Inverted hammer is a bottom heavy with real body and has a long upper shadow. The long upper shadow of a inverted hammer is the important aspect of the pattern. It indicates that the buying pressure might bust begin. The next trading day needs to confirm its bullish reversal signal with a strong bullish candle. 

Sunday 13 October 2013

Technical Analysis: - Chart Patterns

          Chart Patterns are used to identify signals to traders that the price of a currency pair is likely to move in one direction or another when the pattern is complete. There are two types of patterns: reversal and continuation. A reversal pattern signals that prior trend will reverse on completion of the pattern and a continuation pattern signals that the prior trend will continue onward upon the pattern's completion.
          Some of the important chart patterns used by traders are as explained below:
  1. Head and Shoulder Pattern: - Head and Shoulder pattern is considered as the most reliable chart pattern in technical analysis. It is a reversal pattern which signals that a price is set to fall, once the pattern is complete.  It is formed by a peak known as shoulder, followed by another higher peak known as head and then one another lower peak known as shoulder. A neck line is drawn by connecting the lowest points of the two shoulders. When the slope of the neck line is down, it produces a more reliable signal.
  2. Inverted Head and Shoulder Pattern: - Is the exact opposite of the head and shoulder pattern. It signals that price is set to rise, and such pattern is usually formed during a downtrend. Like head and shoulder pattern, it also has a shoulder, followed by an even lower rally (head), and then another higher rally (shoulder). For the inverted head and shoulder pattern, when price breaks above the neckline with large volumes, it signals heavy buying and indicates that the price is bound to rise sharply.              
  3. Double Top Pattern: - Double top is a reversal pattern that is formed after an extended up move.  The "Tops" are peaks which are formed when the price hits a certain level that can't be broken. After hitting this high level, the price will bounces off it slightly, but then  it return back to test the level again. It the price bounce off of that level again then you have the double top. Normally the second top is not able to break the first top. This indicates that buying pressure is about to get over and a trend reversal is about to occur. The pattern is confirmed when the price moves below the neckline.                           
  4. Double Bottom: - Double bottom is also a trend reversal pattern. But it is exactly opposite chart pattern of the double top. It signals a reversal of the downtrend in to an uptrend. This formation occurs after extended downtrends when two rallies have been formed. The price formed two rallies weren't able to go below a certain level and second bottom wasn't able to break the first bottom. This shows that the selling pressure is about to get over and a trend reversal is about to occur.                               
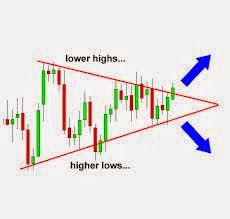
  5. Symmetrical Triangle Pattern: - This is mainly considered to be continuation pattern that signals a period of consolidation in a trend followed by a resumption of the prior trend. Symmetrical triangles are chart formations where the slope of the price's highs and slope of price's low converge together to a point where it looks like a triangle.  This means that nor the buyers nor the sellers are pushing the price far enough to make a clear trend. It is like a battle between the buyers and sellers. As these two slopes get closer to each other, it meas that a breakout is getting near.                                                  
  6. Ascending Triangle Pattern: - The ascending triangle is a bullish pattern, which indicates that the price of the currency pair is is headed higher upon completion of the pattern. This type of formation occurs when there is a resistance level and a slope of higher lows. At the certain level the buyers cannot seem to exceed. But buyers were gradually starting to push the price up as evident by the higher low.   
  7. Descending Triangle Pattern: - Descending triangle pattern is the exact opposite of the Ascending triangle pattern. The descending triangle is a bearish pattern. It suggests that the price will trend downward upon completion of the pattern.  This type of formation occurs when there is a support level and a slope of lower highs. Sellers gradually starting to push price down a evident by the lower highs.   

Saturday 12 October 2013

Technical Analysis: - Charts

          Almost 75% of traders make use of technical analysis to plan their entry and exit in currency trading. Technical analysis is nothing a method of evaluating currency pairs by analysing statistics generated by their market activity.

Basic principles of Technical Analysis

  • Market reflects everything.
  • Price always moves in Trends.
  • History Repeats Itself.
Types of Charts:
  1. Line Chart: - Line chart is the simplest form of chart. Only closing price of currency pairs of each day is platted in a line chart. 
     
  2. The Bar Chart: - Bar charts are the most popular type of charts used in technical analysis. The top of the vertical line indicates the highest price of a currency traded during the day and the bottom represents the lowest price. The closing price is displayed on the right side of the bar and opening price is shown on the left side of the bar. Bar chart is better than line chart because it shows the high, low, open and closing price at the same time. 

  3. Candle Stick Chart: - This type of chart are first used by Japanese to analyse the price of rice contracts. Candle Stick charts also display the open, close, high and low price. In candle stick charting different color's used to show the upward or downward movement of equity.
Important concepts related to Forex and charts
          Few of the important concepts related to charts are discussed below.
  • Support: - Support is the price level at which demand of currency pair is thought  to be strong enough to prevent the price from declining.  Buyers become more inclined to buy and sellers become less inclined to sell at the support level.  After support level is penetrated, it often become the resistance level.
  • Resistance: - Resistance is the price level at which selling of currency pair is thought to be strong enough to prevent the price from rising further. As per logic the price advances towards the resistance sellers become more active and buyers become less active. After resistance level is penetrated it often becomes support level. 
       
  • Moving Average: - One of the the major concept and easiest to understand indicators; the moving average shows the average value of currency's price over a period of time. By "moving average", we mean that we are taking the average closing price of a currency pair for the last "X" number of periods. Moving average are most often used when compared with other indicators such as MACD, Bollinger Bands, etc.
  • Trends: - A trend is simply the direction in which a price of a currency pair moves over a specific period. If there are higher tops and higher bottoms it indicates the uptrend for the specific period and if there are lower tops and lower bottoms it indicates the down trend for the specific period. When a currency is in uptrend buying at lower support and selling at higher tops suggested. 
  • Volume: - Volume consists of the total amount of currency traded within a day. Volume suggest that there is interest and liquidity in certain market. Low volume warn the trader to go away from the market. A healthy uptrend should have higher volume on the upward legs of the trend and a healthy downtrend should have higher volume on the downward legs.
  • Open Interest: - Open Interest is total outstanding position in a certain currency pair. Open Interest refers to the total number of contracts that have not been settled in the immediately previous time period. A large open interest indicates more activity and liquidity for the currency.

Thursday 10 October 2013

Forex And Fundamental Analysis

          A Forex trader must use both Fundamental and Technical Analysis to plan his entry and exit strategy in Forex trading.

What is Fundamental Analysis?

          The fundamental analysis is based on theoretical model of exchange rate determination and on the economic and political factors affecting the foreign exchange rates.
          Fundamental analysis is a very effective way to forecast economic conditions. Fundamentals are classified into economic factors, political factors, financial factors & crises.  Forex trader must watch economical data listed below.
  1. Gross National Product (GNP)
  2. Gross Domestic Product (GDP)
  3. Consumption Spending
  4. Government Expenditure
  5. Interest Rate Announcement
  6. Trade Balance
  7. Inflation Rates
  8. Industrial Production Rate
  9. Unemployment Rate
  10. Non Farm Payroll
  11. Home sales
  12. Crude Oil inventories
  1. Gross National Produce (GNP): - The Gross National Product indicates the economic performance of the whole economy.  This indicator consists of government spending, investment spending, and consumption spending and net trade.  The Gross National Product refers to the sum of all goods and services produced by any country. A higher than expected GNP should be taken as positive as and lower than expected should be taken as negative.
  2. Gross Domestic Product (GDP): - The GDP indicates the sum of all goods and services produced in the country either by domestic or foreign companies. It is the major grown indicator. If GDP went negative for two consecutive quarters the country considered as in recession.  And if it is positive for two consecutive quarters the economy considered as in progression. 
  3. Consumption Spending: - Consumers decision either to save or to spend is psychological in nature. Consumer’s confidence is a major indicator of prosperity.  Consumer’s confidence leads him from saving to buying. A higher than expected reading is considered positive for country a lower one is considered as negative for country.
  4. Government Expenditure: - Government expenditure is a very influential indicator in terms of both sheer size and its impact on other economic indicators.  A higher than expected reading is considered positive for country a lower one is considered as negative for country.
  5. Interest Rate Announcement: - Fundamentally if any country raises interest rate, its currency should become strong and if any country reduces its interest rate, its currency becomes weak. An Interest rate announcement has huge impact in the currency market tries to find the future direction of the interest rate from the authority. A higher than expected interest rate is considered positive for country a lower one is considered as negative for country.
  6. Trade Balance: - This report refers the difference between exports and imports of a country.  It is healthy for a country to have a trade surplus.  Because the foreigners must by the domestic currency to pay for the nation's exports, it may have measurable affect on any currency. A higher than expected reading is considered positive for country a lower one is considered as negative for country.
  7. Inflation Rates: - Consumer Price Index indicates the inflation in country. CPI hints at future rate chance in the country.  Higher inflation rate indicates increasing interest rate and thus strengthen the currency. A higher than expected reading is considered positive for country a lower one is considered as negative for country.
  8. Industrial Production Rate: - The Industrial Production measures the change in the total outputs of the countries manufacturing, mining and other industries.  If represents us a good indicator of strength in the manufacturing sector. A higher than expected reading is considered positive for country a lower one is considered as negative for country.
  9. Unemployment Rate:  - The unemployment rate indicates the percentage of the total labor force that is unemployed but actively seeking employment.  A high percentage indicates weakness in the labor market and lower percentage is a positive indicator the labor market in the country. A higher than expected reading is considered negative for country a lower one is considered as positive for country.
  10. Non-farm Payrolls: - The non-farm payrolls indicate the change in the number of employed people during the last month of all non-farming businesses. Jobs added or lost in the sector is the single most important piece of data contained in the employment report, which considered offering the best overview of the economy. A higher than expected reading is considered positive for country a lower one is considered as negative for country.
  11. Home Sales: - The existing and new home sales reefers the annualized number of existing and new residential buildings that were sold during the previous month. This indicator can be used to analyze the strength of the housing market in the country and which helps to analyze the economy. A higher than expected reading is considered positive for country a lower one is considered as negative for country.
  12. Crude Oil Inventories: - Crude Oil Inventories measures the weekly increase in barrels of commercial grade crude oil held in inventory by domestic firms. The level of inventories influences the price of petroleum products, which may have an impact on inflation and other economic forces.

Sunday 6 October 2013

How To Earn Money In Forex Trading?

          There are two ways to earn money in Forex trading. Any one can earn money by day trading or positional trading.
  1. Day Trading: - Day trading in Forex market includes buying & selling currency, futures & options of currencies with the goal of making profit due to volatility in the price during the day.  The positions in day trading never held overnight irrespective of profit or loss.
  2. Positional Trading: - The goal of positional trading is to profit from the move the primary trends rather than profiting from fluctuation that occur during the day.  Positions are carried forward more than a day.
What we have to trade in Forex market? 
 
          There are many variants available in Forex market for trading. The major options for trading are:
  1. Currencies: - Many brokers provide as much of 30 currencies for trading in the Forex market. The major currencies are USD, EUR, JPY, GBP, CHF, AUD & CAD.
  2. Derivatives: - Derivatives are the financial instruments linked to currencies or indicators. Below mentioned are the derivative products that are commonly used in the Forex Markets.
  • Forwards: - A Forward contract is customized contract between two counter-parties where settlement takes place of a specific date in the future at today's accepted price.
  • Futures: - A futures contract is an agreement between two counter-parties to buy or sell an asset at a particular time at a certain price. 
  • Options: - As like in any market options are of two types; calls & puts.
  • Warrants: - Longer dated options are called  warrants.  Options generally have lives of up to one year.
  • Leaps: - Leaps are the options having a maturity of up to three years.    
How much money any one can make through Forex trading?
          
          The amount any one can make out of Forex trading depends upon:
  1. The amount invested: - The more amounts invested more are the earnings.
  2. Risk taken: - Higher the risk taken, higher are the chances of return. (there are also chances to loose higher amount)
          The exact profit depends on:
  • Net gain per trade.
  • Number of trades.
  • Brokerage
  • Leverage utilized.
How to earn money in Forex trading?
 
          Let us try to understand with help of an example.
 
          David thinks that EUR will appreciate as compare to USD. 
  • He observes the Bid/Ask prices of EUR/USD currency pair, prices are 1.2368/1.2370. 
  • David makes a purchase of 1000 Euros. His investment is $1237. 
  • After five days EUR appreciates as considered by David.
  •  At the fifth day from purchase the Bid/Ask prices are 1.2542/1.2544. 
  •  David sells 1000 EUR he previously had bought.
  •  He gets $1254.2 from the entire transaction.
  •  The profit made by David is 1254.20-1237.00=17.20$.
          After completing the first trade David thinks that EUR will depreciate as compare to USD.
  • As the Bid prices of EUR/USD Currency pair are 1.2542/1.2544.
  • He sells 1000 EUR at the rate 1.2542.
  • He gets $1254.20 from this transaction.
  • After two hours he observes the Bid/Ask prices.  The prices are 1.2432/1.2434.
  • David buy's 1000 EUR at the rate 1.2434. His investment is 1243.4
  • David's profit from this entire transaction is 1254.20-1243.40=10.08$
          If you feel that base currency will appreciate compare to the quote currency then you shall buy the currency pair, and if you feel the base currency will depreciate compare to quote currency then you must sell the currency pair.
 

Forex Terminology

If any one has to understand any subject, he must know the terminology of the subject. So let us know the basic terms related to Forex.
  1. Base Currency: - Base currency is the first currency quoted in the currency pair. For example if the currency pair is shown as USD/EUR, USD is the base currency.  Base currency is also known as primary currency.
  2. Bear: - An investor who anticipates that a currency pair will decline in value is known as bear.
  3. Bid, Asks & Spread: - Bid is the price at which you can sell the primary currency.  Ask is the price at which you can buy the base currency. The difference between the bid and ask is known as the spread.
  4. Bull: - An investor who anticipates that a currency pair will appreciate in value is known as bull.
  5. Currency Pair: - In the foreign exchange market currencies are always quoted in pairs. This is known as currency pair. For example USD/INR.
  6. Cross Exchange Rate: - Cross exchange rate is the exchange rate between two currencies traded in the Forex market that does not include the US dollar. For example INR/EUR.
  7. Exchange rate: - The rate which indicates the worth of one currency against another currency is known as exchange rate.
  8. Forex: - Forex is the market where currencies are bought and sold.
  9. Forward Outright: - A foreign exchange forward transaction, commonly referred to as forward outright, is a contract between two counter-parties to exchange one currency for another on a specified future date.
  10. Forward Margin: - The difference between spot rate and forward rate is called as "forward margin".
  11. Hedging: - A strategy design to reduce investment risk by investing in alternative instrument that offsets the risk of base portfolio is known as hedging.
  12. Initial Margin: - The minimum amount of cash deposit that is required to trade a currency pair is known as initial margin.
  13. Leverage: - Leverage is the amount of cash one can borrow from his broker to increase the potential return of his investment.
  14. Limit Order: - It is an order to buy or sell a currency pair when it reaches a specified price level.
  15. Long Position: - If a currency pair is bought with the expectation that it will be appreciated, this act is known as long position.
  16. Market Order: - It is an order to buy or sell a currency pair at the price immediately available.
  17. Open Position: - Any activity either buying or selling but not has been settled is known as open position.
  18. PIP: - A PIP is the smallest price unit of a Forex currency pair that can be bought or sold.
  19. Short Position: - If a currency pair is sold with the expectation that it will decline in its value, known as short position.
  20. Spot: - A foreign exchange spot trading, commonly referred to as Spot, is buying of currency with a different currency for immediate delivery.
  21. Swaps: - The simultaneous purchase and sale, or vice verse, of identical amounts of one currency for another with two different value dates is known as a foreign exchange swap.
  22. Technical Analysis: - Technical Analysis is the method to evaluate the currency pair by analysing statics generated by historical market activity such as past price and volume. Technical analysis uses charts to identify patterns that can suggest future activity.

Saturday 5 October 2013

An Introduction to Forex Trading

          Many of us are familiar with stock and commodity trading. But most of us are new to Forex. In Forex currencies are bought and sold.
          Forex is short form of Foreign Exchange. Forex is the biggest fiscal market in the world. The daily turnover of Forex is reputed to be more than  trillion dollars. Forex is the most liquid market in the world.

Advantages of Forex Market

          The advantages of Forex market are:
  1. High Leverage: - Forex trading offers very high leverage as compared to that offered in the stock or commodity market. The leverage offered in Forex market varies from broker to broker and in the range of 1:100 to 1:500. For example in 1:300 Forex account a deposit of $1000 will gives you the purchase power of $300,000 in the currency market.
  2. 24 Hours Trading Opportunity: - The Forex market is open from Sunday evening to Friday afternoon.  This gives an investor an opportunity to choose his trading hours. This is the most convenient part of Forex trading.
  3. Highest Liquidity: - Because of its huge size Forex market is extremely liquid. That means at any time you can sale any thing in the Forex market.  You don't have to weight for any thing.
  4. Free Demo Account: - Most of the online Forex firms offer free "Demo" accounts for trading practice.  This will provide an opportunity to maximize the skills with virtual money before opening a live trading account.  The trader can open both live and demo account at the same time and check the possibility and amount of profit at various percents of investment. After checking he can perform a live trade.
  5. Profit in both 'bull' and 'bear' market: - One of the most exciting advantages of  Forex market is the ability to generate in the bullish or bearish market.  Trader can long the position in bullish market and short the position in bearish market.
Major Currencies involved in Forex Trading

          The 6 most traded currencies in the Forex trading are:
  1. U.S. Dollar (USD): -The United States dollar is the official currency of the United States of America. The U.S. dollar is the most traded currency in the Forex Market and is also one of the world's reserve currencies.  U.S. dollar is considered as the most safe currency in the world.
  2. European Euro (EUR): - The euro is the official currency of the euro-zone: 17 of the 28 Member States of the European Union. The euro is the second largest reserve currency as well as the second most traded currency in the world after the U.S. dollar.
  3. Japanese Yen (JPY): - The Japanese Yen is the official currency of Japan. It is third most traded currency in the Forex market. It is also widely used as reserve currency after the U.S. dollar, the euro and the pound sterling. It is also known for its high liquidity.
  4. British Pound (GBP): - British Pound is official currency of the United Kingdom(UK). Pound Sterling is the third largest reserve and fourth most traded currency in the Forex market.
  5. Swiss Franc (CHEF): - The franc is the official currency of Switzerland. It is believed that Swiss franc is the most stable currency in the world.
  6. Australian Dollar (AUD): - The Australian dollar is the official currency of Australia.  Although in low percentage but still it is known as the major currency in the Forex market.
Currency Pair

          In the Forex market, currencies are always traded in pairs and known as currency pair. The eight major currency pairs that are mainly traded are EUR/USD, USD/JPY, GBP/USD, CHF/USD, EUR/JPY, EUR/GBP, GBP/JPY and GBP/CHF. Other than these major currency pairs there are some minor currency pairs like AUD/USD, USD/CAD andUSD/INR etc are also traded.
          In the currency pair, the first currency is referred as the base currency and the second currency is known as the quote or counter currency. The exchange rate indicates the worth of the base currency in terms of the counter currency.  For example a USD/EUR pair rate of 0.74 implies that the 0.74 Euros must be paid to obtain one U.S. dollar.

Types of  Orders

          There are two types of orders to be placed to buy or sell any currency pair.
  1. Market Order: - It is an order to buy or sell a currency pair at the current rates at which is dealing.
  2. Limit Order: - It is an order to buy or sell a currency pair when it reaches a specific price level. After you have placed entry order, you can place a stop loss order to safeguard yourself.

What Is Foreign Exchange?

Foreign Exchange

          Any monitory transaction between people of any two countries, including exchange of one currency for another is known as foreign exchange.
          The term "foreign exchange" demonstrates buying of currency of one country and selling the currency of another country.

Who needs foreign exchange?
  1. Any individual or company engaged with import or export business.
  2. Any investor investing money abroad.
  3. Any person working abroad.
  4. Any tourist who travels another country.
Authorities in foreign exchange market
  1. Central Banks: - The most influential authorities in the foreign market are the central banks of countries involved in foreign exchange market. Central banks always control the factors like supply of money, interest rates and inflation level. Central banks use their reserves of currency to stabilize market conditions.
  2. Banks: - Banks are also the major authorities participating in Forex market. Large transactions are conducted by banks either on their own or on behalf of their customers.
  3. Brokers: - Foreign exchange brokers perform a large amount of business every day and earn their commission for the work they do.
  4. Commercial Organizations: - Commercial companies and organizations are important part of the inter-bank transactions. They need foreign currency to pay for goods or services, they purchase.
  5. Investment Firms: - Investment firms like insurance companies, pension funds, mutual funds are the major players in the Forex market.  They perform on behalf of their investors related to their investment schemes in order to meet the investment goals for the benefit of the investors.
  6. Hedge Funds: - Hedge funds can control billions of dollars in equities and have the capacity of purchasing billions more.  They are also the most powerful authorities in the market.
Exchange Rate
          Exchange rate is the value of any foreign nation's currency in terms of home nation's currency.  It indicates how much one currency worth's against other currency.
          For example an exchange rate Euro vs dollar is 1.36.  This means that 1 Euro worth's the same as 1.36 dollar.
Types of Exchange Rates 
 
          The basic types of foreign exchange rates are -
  1. Fixed exchange rate: - Fixed rate are the rates fixed by the monitory authorities and are typically set to a per-determined value (e.g., the value of ounce of gold) and are allowed only slight amount of fluctuation.
  2. Floating exchange rate: - In floating exchange rate system currency's value are allowed to be fluctuating according to the foreign exchange market. Floating exchange rate is determined by the market force of supply and demand.  
The problems in foreign exchange
  1. Different countries have different currencies.
  2. There are too many restrictions imposed by the countries on foreign exchange.
  3. There are too many restrictions imposed by the countries on import and export of goods.
  4. All countries have different legal practices and jurisdictions.