
Chart Patterns are used to identify signals to traders that the price of a currency pair is likely to move in one direction or another when the pattern is complete. There are two types of patterns: reversal and continuation. A reversal pattern signals that prior trend will reverse on completion of the pattern and a continuation pattern signals that the prior trend will continue onward upon the pattern's completion.
Some of the important chart patterns used by traders are as explained below:
- Head and Shoulder Pattern: - Head and Shoulder pattern is considered as the most reliable chart pattern in technical analysis. It is a reversal pattern which signals that a price is set to fall, once the pattern is complete. It is formed by a peak known as shoulder, followed by another higher peak known as head and then one another lower peak known as shoulder. A neck line is drawn by connecting the lowest points of the two shoulders. When the slope of the neck line is down, it produces a more reliable signal.

- Inverted Head and Shoulder Pattern: - Is the exact opposite of the head and shoulder pattern. It signals that price is set to rise, and such pattern is usually formed during a downtrend. Like head and shoulder pattern, it also has a shoulder, followed by an even lower rally (head), and then another higher rally (shoulder). For the inverted head and shoulder pattern, when price breaks above the neckline with large volumes, it signals heavy buying and indicates that the price is bound to rise sharply.

- Double Top Pattern: - Double top is a reversal pattern that is formed after an extended up move. The "Tops" are peaks which are formed when the price hits a certain level that can't be broken. After hitting this high level, the price will bounces off it slightly, but then it return back to test the level again. It the price bounce off of that level again then you have the double top. Normally the second top is not able to break the first top. This indicates that buying pressure is about to get over and a trend reversal is about to occur. The pattern is confirmed when the price moves below the neckline.

- Double Bottom: - Double bottom is also a trend reversal pattern. But it is exactly opposite chart pattern of the double top. It signals a reversal of the downtrend in to an uptrend. This formation occurs after extended downtrends when two rallies have been formed. The price formed two rallies weren't able to go below a certain level and second bottom wasn't able to break the first bottom. This shows that the selling pressure is about to get over and a trend reversal is about to occur.

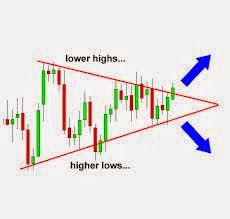
- Symmetrical Triangle Pattern: - This is mainly considered to be continuation pattern that signals a period of consolidation in a trend followed by a resumption of the prior trend. Symmetrical triangles are chart formations where the slope of the price's highs and slope of price's low converge together to a point where it looks like a triangle. This means that nor the buyers nor the sellers are pushing the price far enough to make a clear trend. It is like a battle between the buyers and sellers. As these two slopes get closer to each other, it meas that a breakout is getting near.
- Ascending Triangle Pattern: - The ascending triangle is a bullish pattern, which indicates that the price of the currency pair is is headed higher upon completion of the pattern. This type of formation occurs when there is a resistance level and a slope of higher lows. At the certain level the buyers cannot seem to exceed. But buyers were gradually starting to push the price up as evident by the higher low.

- Descending Triangle Pattern: - Descending triangle pattern is the exact opposite of the Ascending triangle pattern. The descending triangle is a bearish pattern. It suggests that the price will trend downward upon completion of the pattern. This type of formation occurs when there is a support level and a slope of lower highs. Sellers gradually starting to push price down a evident by the lower highs.


No comments:
Post a Comment